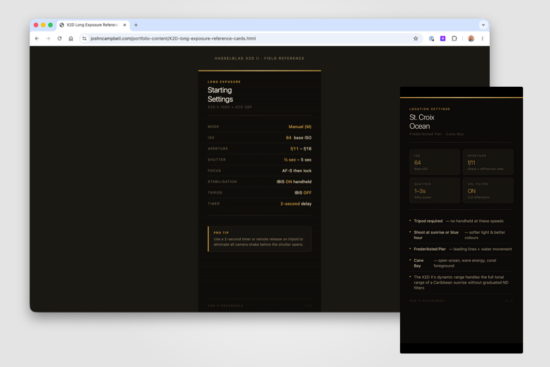
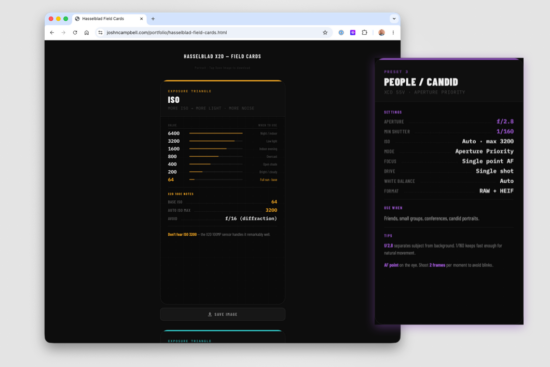
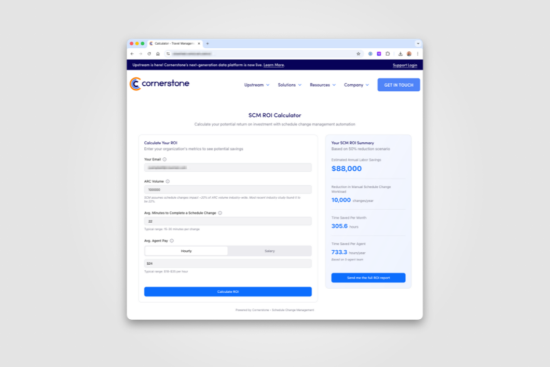
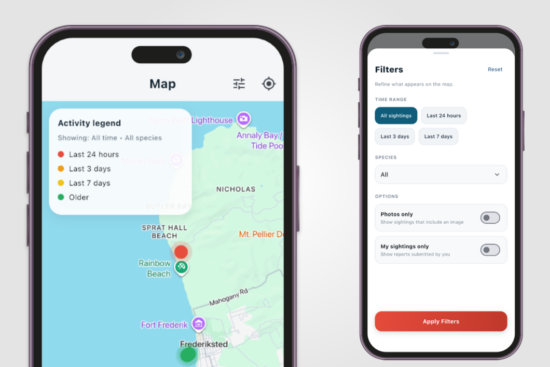
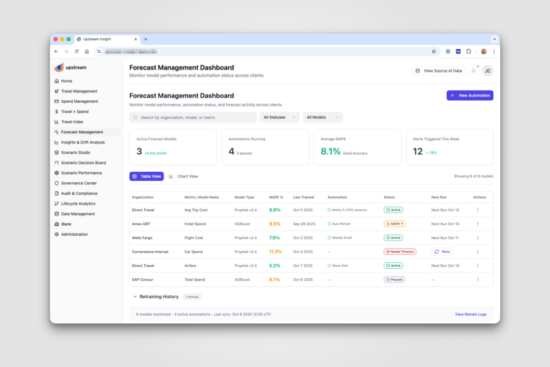
Portfolio

Executive T&E Dashboard overview showing $604K total spend, average trip spend of $1,337 across 452 trips, average report spend of $24,168, and air travel as the top category at $375K. Filters available for timeframe, department, category, and vendor. Trend chart shows steady increase in T&E spend from May to August 2025.

Executive T&E Dashboard

Data Science, Design, UI/UX.

Alt text: Two smartwatches displaying custom watch faces inspired by the TV series Severance. The left watch has a silver mesh band and shows a gray screen with the time “9:14,” a blue toggle labeled “Innie,” and the Lumon Industries globe logo beneath it. The right watch has a black link-style band and a minimalist green-and-beige office illustration featuring a desk, chair, and computer, along with the same “9:14” time and “Innie” toggle.

Severance Apple Watch Faces

Two digital tablets with styluses rest on a light gray background, each displaying minimalist illustrations inspired by Severance. The tablet in the back shows a clean green-and-white office scene with a desk, chair, and old-style computer. The tablet in front displays a minimalist lobby with four green armchairs and an elevator at the center, framed by white walls and green flooring. Both images share the same flat, geometric Lumon-inspired art style.

Severance Wallpapers for Tablet

A minimalist digital illustration inspired by Severance shows a white background with a green floor. At the top, the word “Innie” appears in black next to a blue toggle switch turned on. Below, a simple office desk setup includes a white desk, an old-style computer monitor, a blue notebook, and a dark blue office chair. At the bottom center is the Lumon Industries logo, rendered in navy blue.

Severance Office Wallpaper

A smartphone screen shows a minimalist lock screen with a gray background. At the top, the date reads “Wednesday, October 5,” and the large time display shows “19:14.” Below the time are three circular icons representing battery, activity rings, and weather (25% chance of rain). Centered on the screen is a blue toggle switch labeled “Innie,” which is turned on. At the bottom is the Lumon Industries logo, featuring a globe outline with the word “LUMON” in the center — a reference to the TV series Severance.

Severance Innie Wallpaper

Queue Monitor dashboard showing a table of active iQCX queue monitors with fields for account ID, GDS, PCC, queue, category, status, and pause time. A search bar, export options, column settings, and filter button appear above the table. A ‘Create New’ button is available in the top right.

Queue Monitor

Design, UI/UX.

Upstream by Cornerstone login screen with centered card layout. The form includes fields for email address and password, with a password visibility toggle and a ‘Forgot password?’ link. A blue ‘Sign in’ button is below the fields, followed by links to Privacy Policy and Terms of Use. A TRUSTe verified badge and © 2025 Cornerstone Information Systems, Inc. appear at the bottom. Background features a soft gradient for a clean, modern look.

Login Screen

Design, UI/UX.

Upstream by Cornerstone error page with message ‘No permission.’ The illustration shows a dark cloud with rain above white clouds in the sky. Inside the cloud is a flight arrivals display showing ‘Flight 403 – No Permission.’ A button below reads ‘Go to home.’

Error Messages

Design, Illustration, UI/UX

Dashboard view of Upstream’s Travel Index Dashboard for September 2025. It displays travel analytics and insights including: average trip cost $1,449 (up 5.4%), average flight cost $731 (up 13.5%), average hotel spend $523 (up 0.8%), and average car rental spend $194 (up 2.7%). Other metrics include average purchase window 4.2 days (down 18.3%), top expense category air travel (down 8.3%), total expense data $2.4M (down 8.9%), and active travelers 847 (down 15.2%). Below are two charts: a line graph showing 6-month travel cost trends by category (airfare, car rental, hotel, total trip cost) and a pie chart showing expense category breakdown with airfare at 40%, hotel at 29%, meals at 9%, and other smaller categories.

Travel Index Dashboard

Design, UI/UX

Illustrated cover and background scene from the children’s book Milo the Mongoose of St. Croix, featuring tropical plants, a smiling mongoose holding a basket of fruit, and a Caribbean landscape with palm trees, a sugar mill ruin, and seagrape leaves.

Milo the Mongoose: Lessons in Sharing & Speaking Up

Design, Illustration

Side-by-side image featuring the cover of Milo the Mongoose of St. Croix on the left and a tropical beach scene with a sprouting plant under the sun on the right.

Milo the Mongoose: Adventures in Trying & Tidying

Design, Illustration

A warm, traditional children’s-book style scene of Milo the Mongoose standing on a sandy shore with gentle Caribbean waves behind him. Flanking Milo are lush green bushes and a bright red hibiscus in bloom; tall palm trees sway overhead, and a distant stone fort peeks above the shoreline. The sky is a soft blue with a few fluffy clouds, evoking a friendly, sunlit morning on St. Croix.

Milo the Mongoose from St. Croix

Design, Illustration

A steaming cup of bush tea on a wooden table surrounded by fresh green leaves and lemongrass, with a rustic kettle in the background.

USVI Life

Coding, Design, Development

Logo for Soap Company

Design, Illustration

Dynamic Reporting Configuration

Design, UI/UX

Data Scoring Dashboard

Design, UI/UX

Hermès Grand H Inspired iOS Wallpaper

Illustration

Hermès En Mer Inspired iOS Wallpaper

Illustration

Asset Manager

Design, UI/UX

Dashboard Feature

Hub Dashboard

Design, UI/UX

Sigma Feature

Sigma Workbook & Visualizations

Coding, Data Science, Design

Event Driven Actions

Event Driven Actions

Design, UI/UX

Fligthy on StandBy

Flighty on StandBy Mode (Concept)

Design, UI/UX

Cornerstone Hub

Design, UI/UX

User Personas

Design, Illustration

WorldWatch+

Traveler Security Web App

Design, UI/UX

Partner Market

Artwork for Partner Market

Design, Illustration

Marketplace Feature

Marketplace Web Design/UI

Design, UI/UX

Ctrip Feature

Ctrip Data Transformation

Coding, Data Science, Development

WV Board of Hearing Aid Dealers Feature

WV Board of Hearing Aid Dealers

Coding, Development

CHOP Feature

Children’s Hospital of Philadelphia

Coding, Data Science, Development

USIT Colours Feature

Sensata Data Transformation

Coding, Data Science, Development

Oerlikon Metco Data Project

Oerlikon Metco Data Project

Coding, Data Science, Development

Portal App

Portal App iOS & Android

Design, Development, UI/UX

Mobile Itinerary

Travel Itinerary Mobile UI

Design, UI/UX

Traveler Scorecard

Traveler Scorecard

Analytics, Data Science, Design

Vizable

Mobile Data Visualization

Analytics, BI, Data Science

Project Dashboard

Project Dashboard

Coding, Design, Web Development

Consolidated Report

Consolidated Excel Report

Coding, Data Science, Excel

Agent Productivity

Agent Dashboard

Analytics, Coding, Data Science

KPI Dashboard

KPI Analysis Dashboard

Analytics, Coding, Data Science

Hotel Analysis

Hotel Analysis Dashboard

Analytics, Coding, Data Science

TE Dashboard

Travel & Expense Dashboard

Analytics, Coding, Data Science

Counting Sheep

Counting Sheep

Painting

Ocean Sky

Ocean Sky

Digital Art

San Francisco

San Francisco

Digital Art

Ocean Sky Drawn

Ocean Sky

Painting

iBank Analytics

Analytics Application

Analytics & Design

DWC

Travel Agency

Web Development

artful blooms

Event Florist

Web Development

Pi Kappa Phi

Fraternity

Web Development

Ponderosa Industries

General Contractor

Web Development