Travel Index Dashboard Forecasting

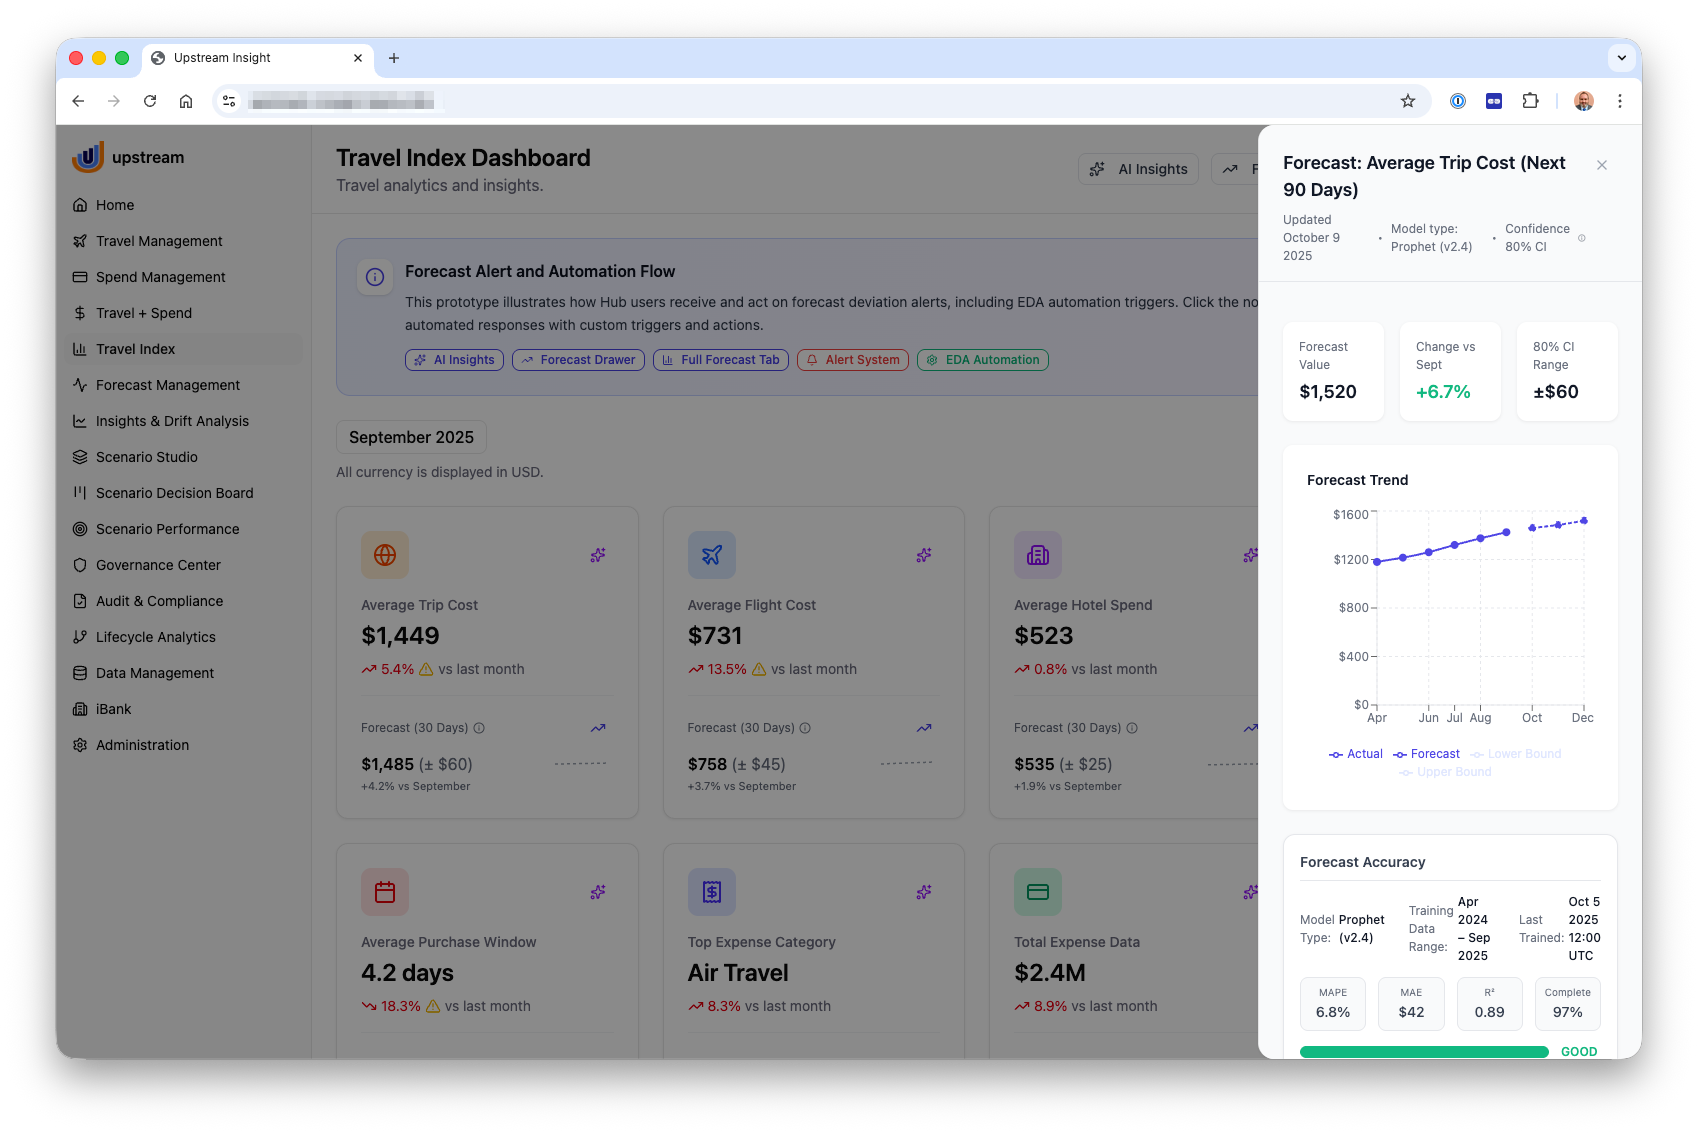
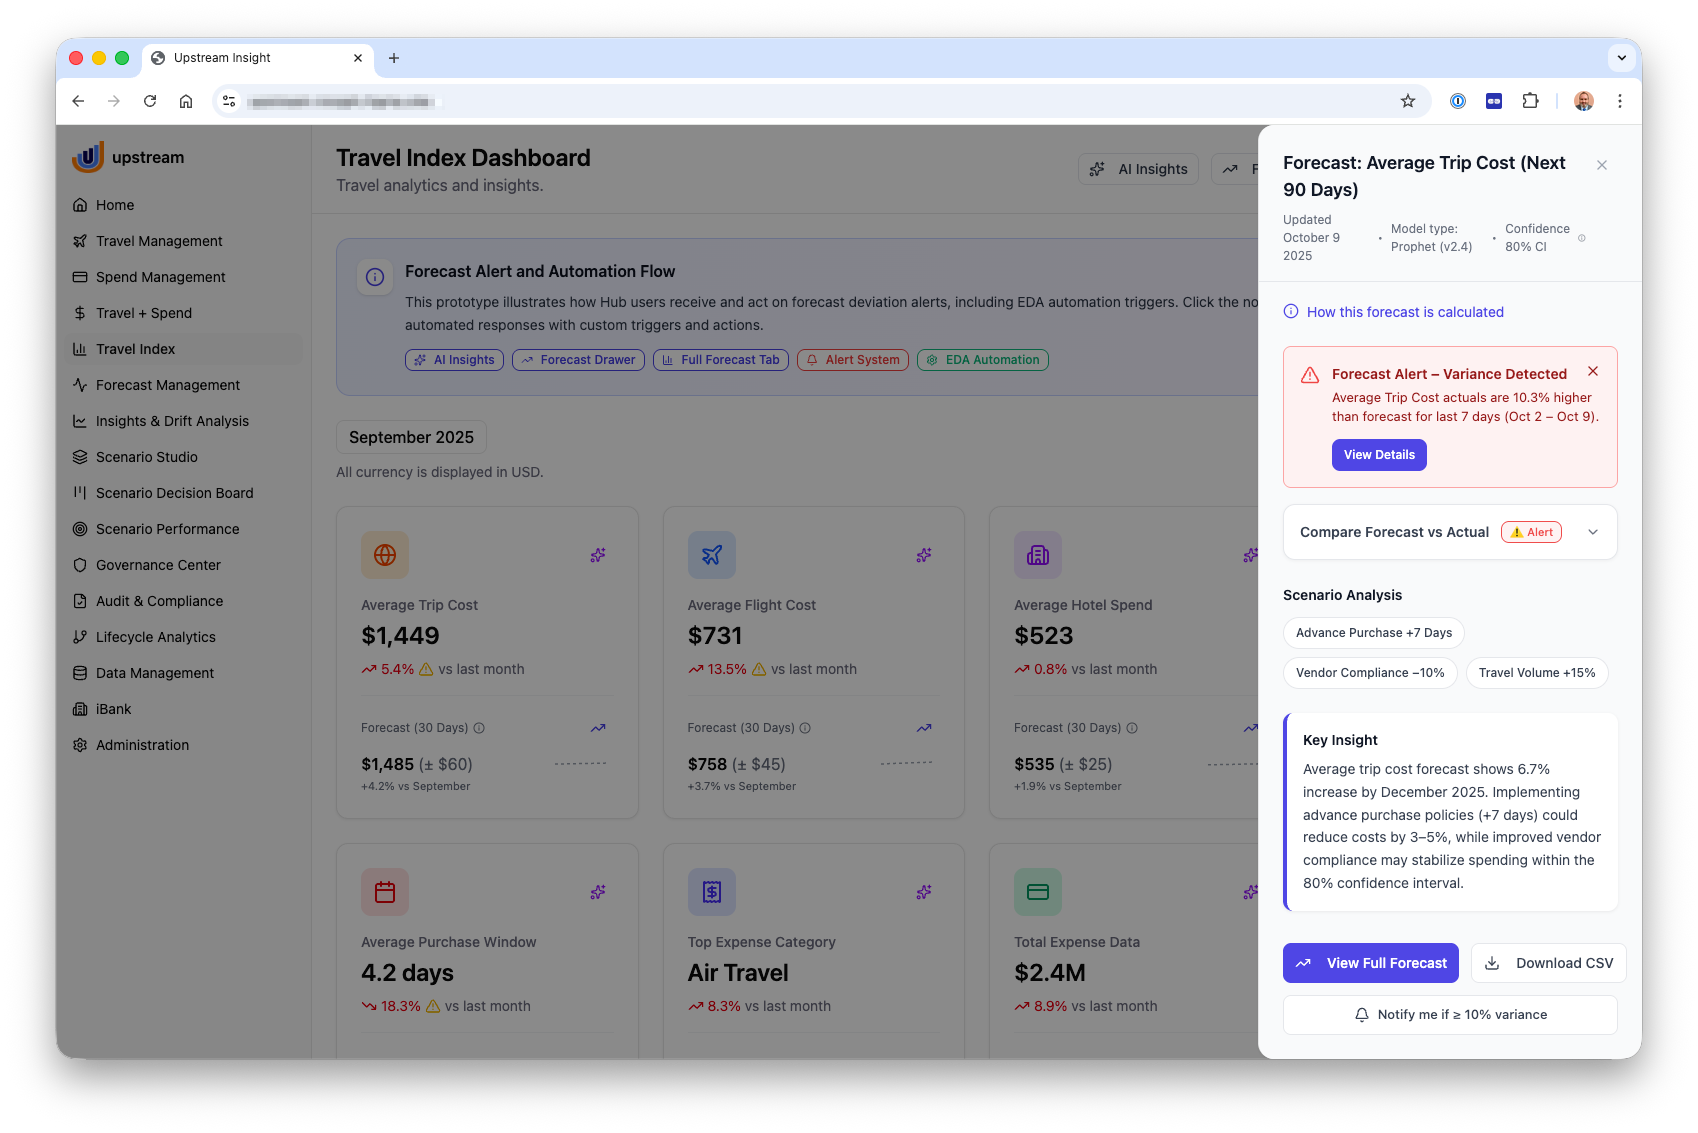
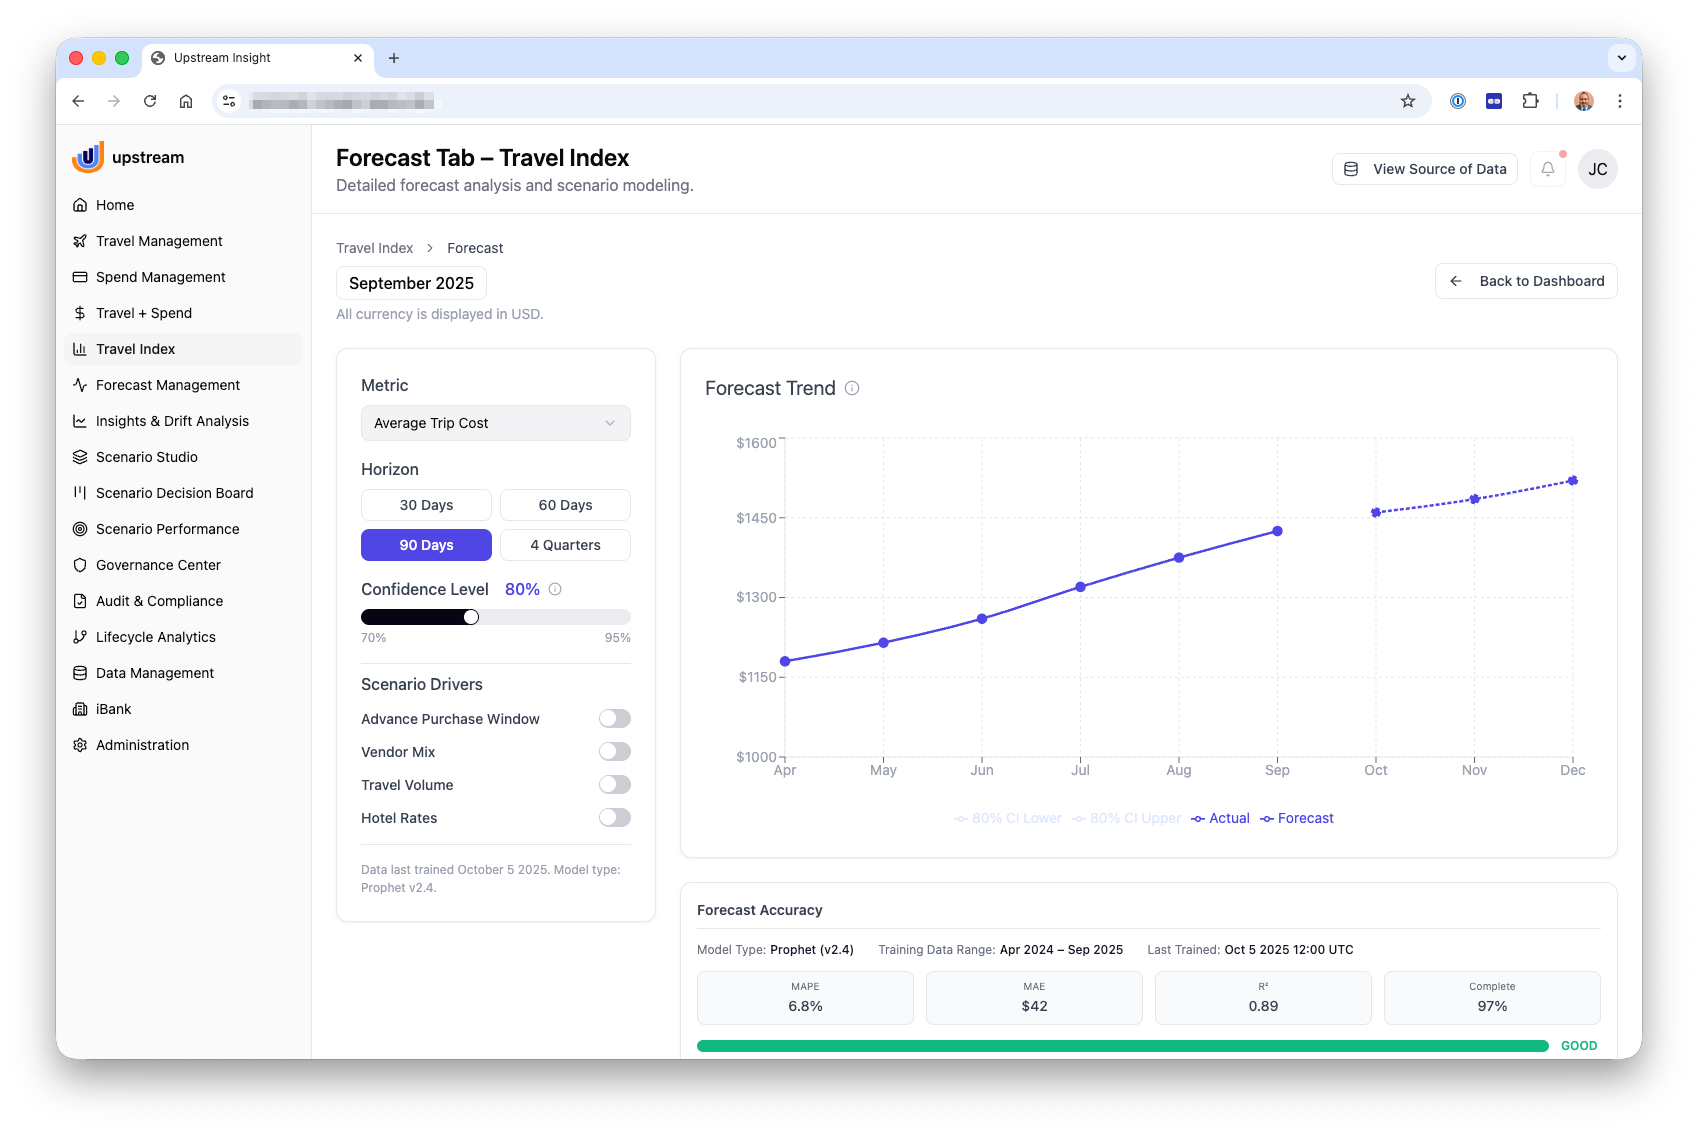
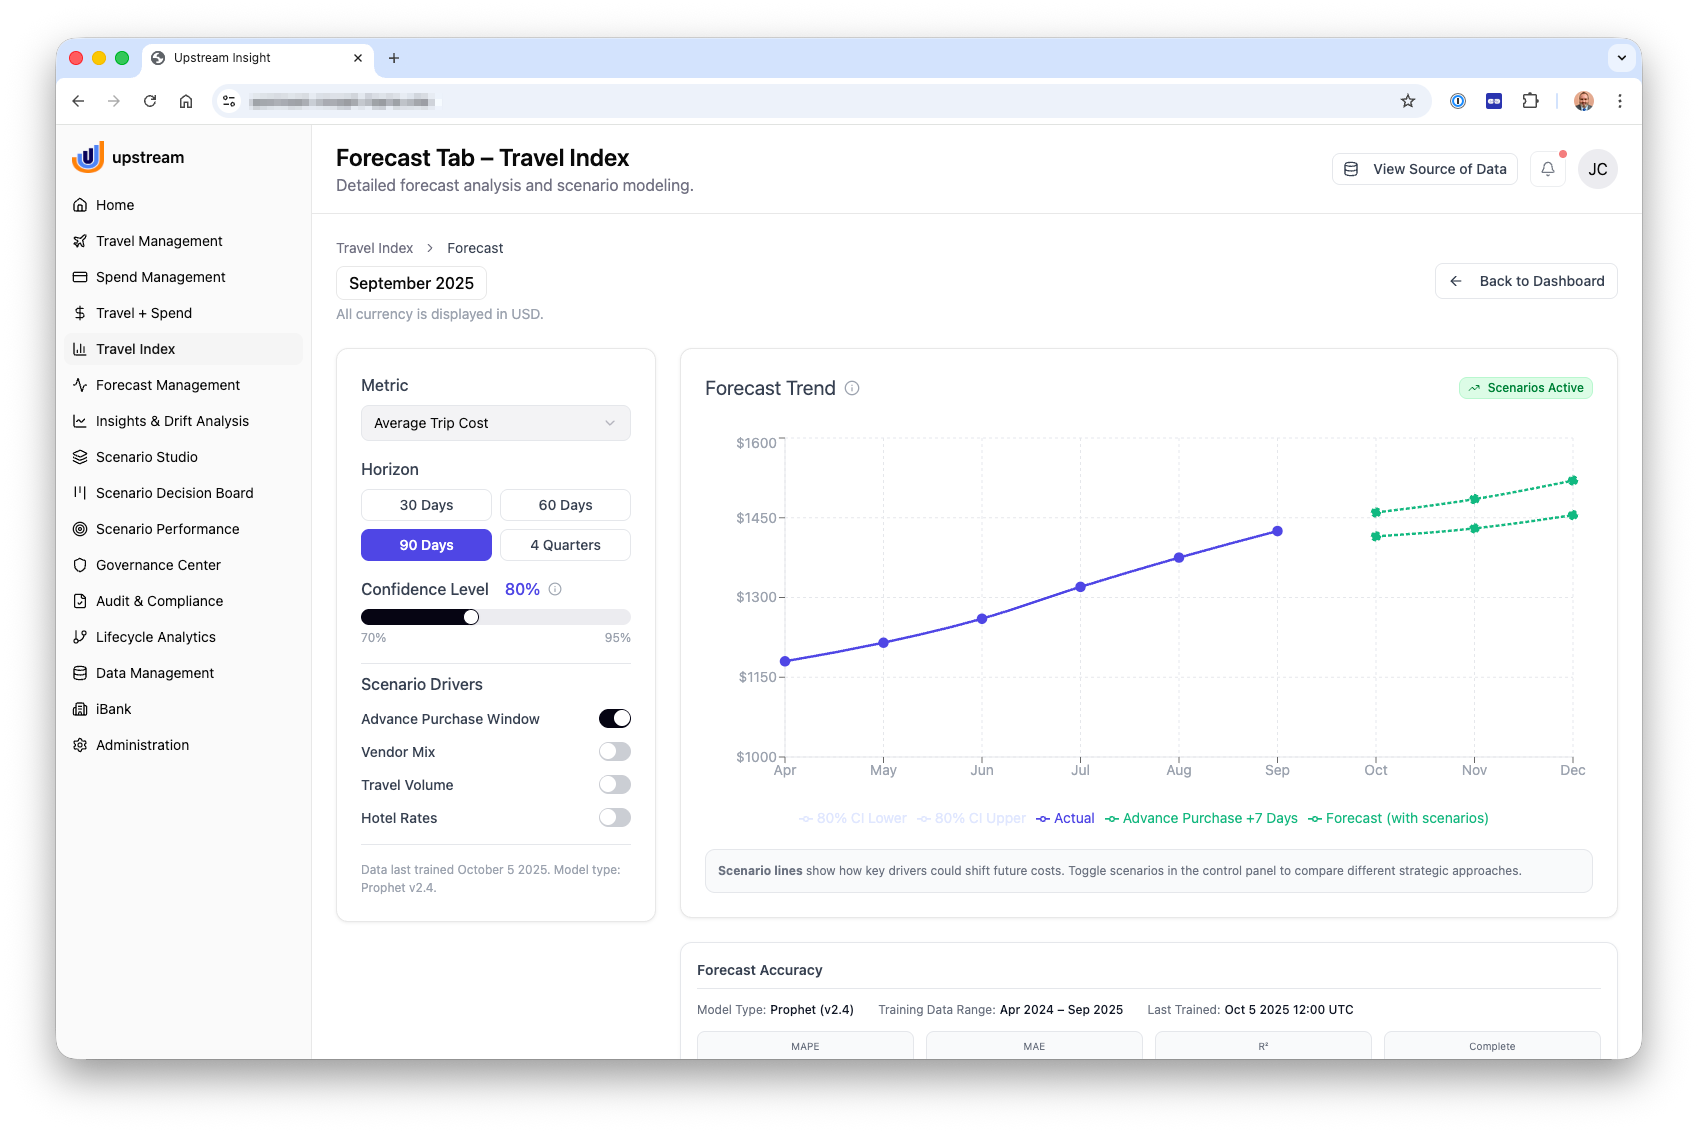
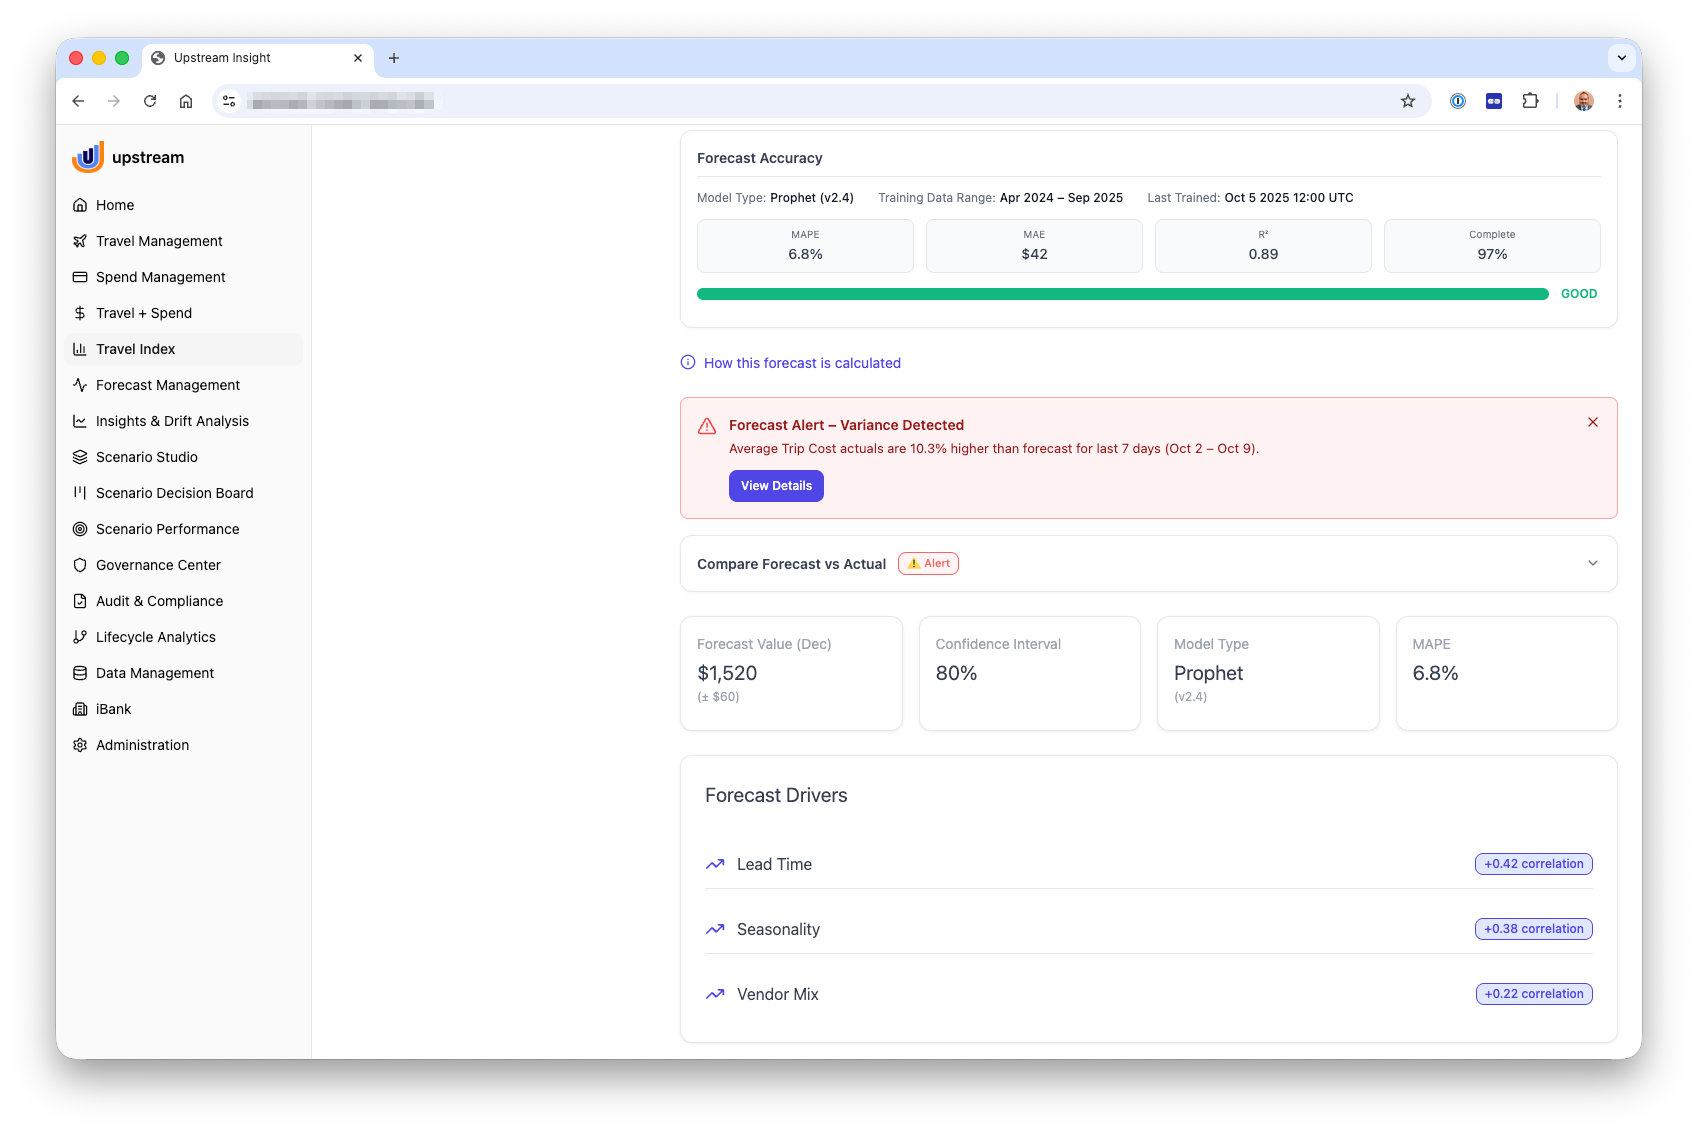
A UI/UX design project that helps corporate travel managers monitor program performance, understand cost trends, and make data-driven decisions. The interface combines analytics dashboards, predictive forecasting, and AI insights to turn complex travel data into clear, actionable information.

Client: Cornerstone Information Systems, Inc. Date: 02-2026 Services: Design, UI/UX.

Travel Index Dashboard showing travel cost analytics with KPI cards for average trip cost, flight cost, hotel spend, and purchase window, alongside a forecast panel predicting average trip cost for the next 90 days with trend visualization and confidence interval

Travel Index Dashboard with forecasting panel showing a variance alert where average trip cost is higher than predicted, including scenario analysis options, forecast comparison tools, and a key insight recommending policy adjustments.

Travel Index forecast analysis interface showing a 90-day prediction for average trip cost with a trend chart, adjustable confidence level slider, forecast horizon options, and scenario driver controls for factors such as advance purchase window, vendor mix, travel volume, and hotel rates.

Travel Index forecasting interface with scenario modeling enabled, showing a 90-day cost forecast trend alongside projected scenario outcomes when the advance purchase window is increased by seven days.

Travel Index forecast monitoring screen displaying a variance alert where average trip cost exceeded the predicted range, alongside forecast accuracy metrics, model details, and key forecast drivers such as lead time, seasonality, and vendor mix.